社区
首页
圈子
科研专栏
科研宝库
回到旧版
登录
研究问答
详情
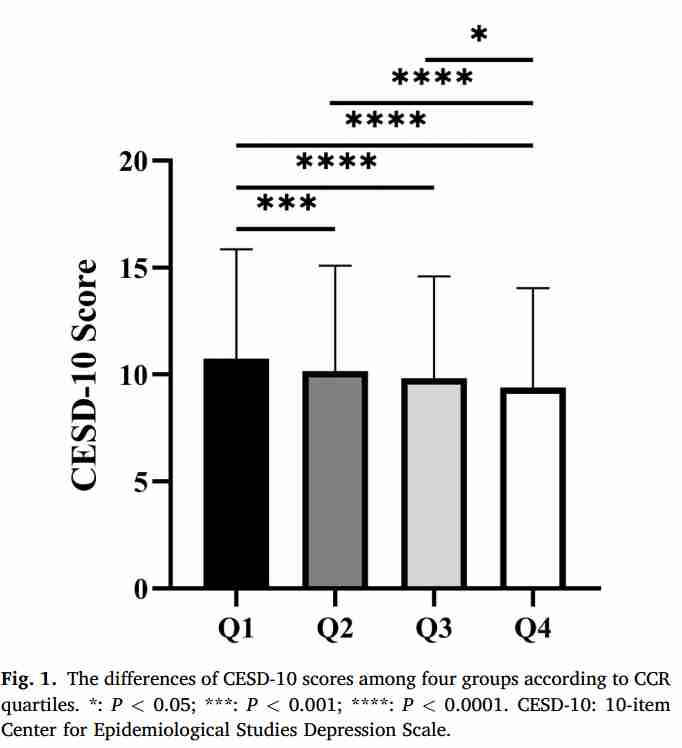
STATA求助 单因素方差分析绘图 这种图是怎么画的啊
stata自己能画出来吗?还是要额外使用绘图软件啊?